HSRBuilder
HSRBuilder is an interactive planning tool for exploring high-speed rail alignments before they become formal engineering designs. It lets a user sketch a route, place stations and control points, analyze terrain, generate a preliminary vertical alignment, and see where the route may require surface running, retained earth, deep cuts, tunnels, bridges, or viaducts.
The goal is not construction documentation. It is early route planning with enough engineering context to make alternatives easier to compare.
The main workspace combines route controls, an editable map, and terrain analysis in one planning surface.
Why I Built It
High-speed rail planning is easy to underestimate from a flat map. A route that looks direct can become difficult once terrain, curve radius, sustained grades, station placement, and major structures are considered. Most casual tools stop at distance and rough geography; professional engineering tools are often too specialized for quick exploration.
True high-speed rail also cannot depend on simply reusing much of the existing rail network. If the goal is frequent, reliable, very fast service, new dedicated tracks will often need to be built in new locations. HSRBuilder is an exploratory first step for asking where those corridors could plausibly go.
I wanted something in the middle: approachable like a map editor, but grounded in the questions that determine whether an alignment is plausible:
- Can this alignment preserve high operating speeds?
- Where does terrain force steep grades or major structures?
- How much of the route is likely at-grade versus elevated, tunneled, or in deep cut?
- How do route changes affect the engineering profile?
- Can alternatives be compared quickly?
What The Product Does
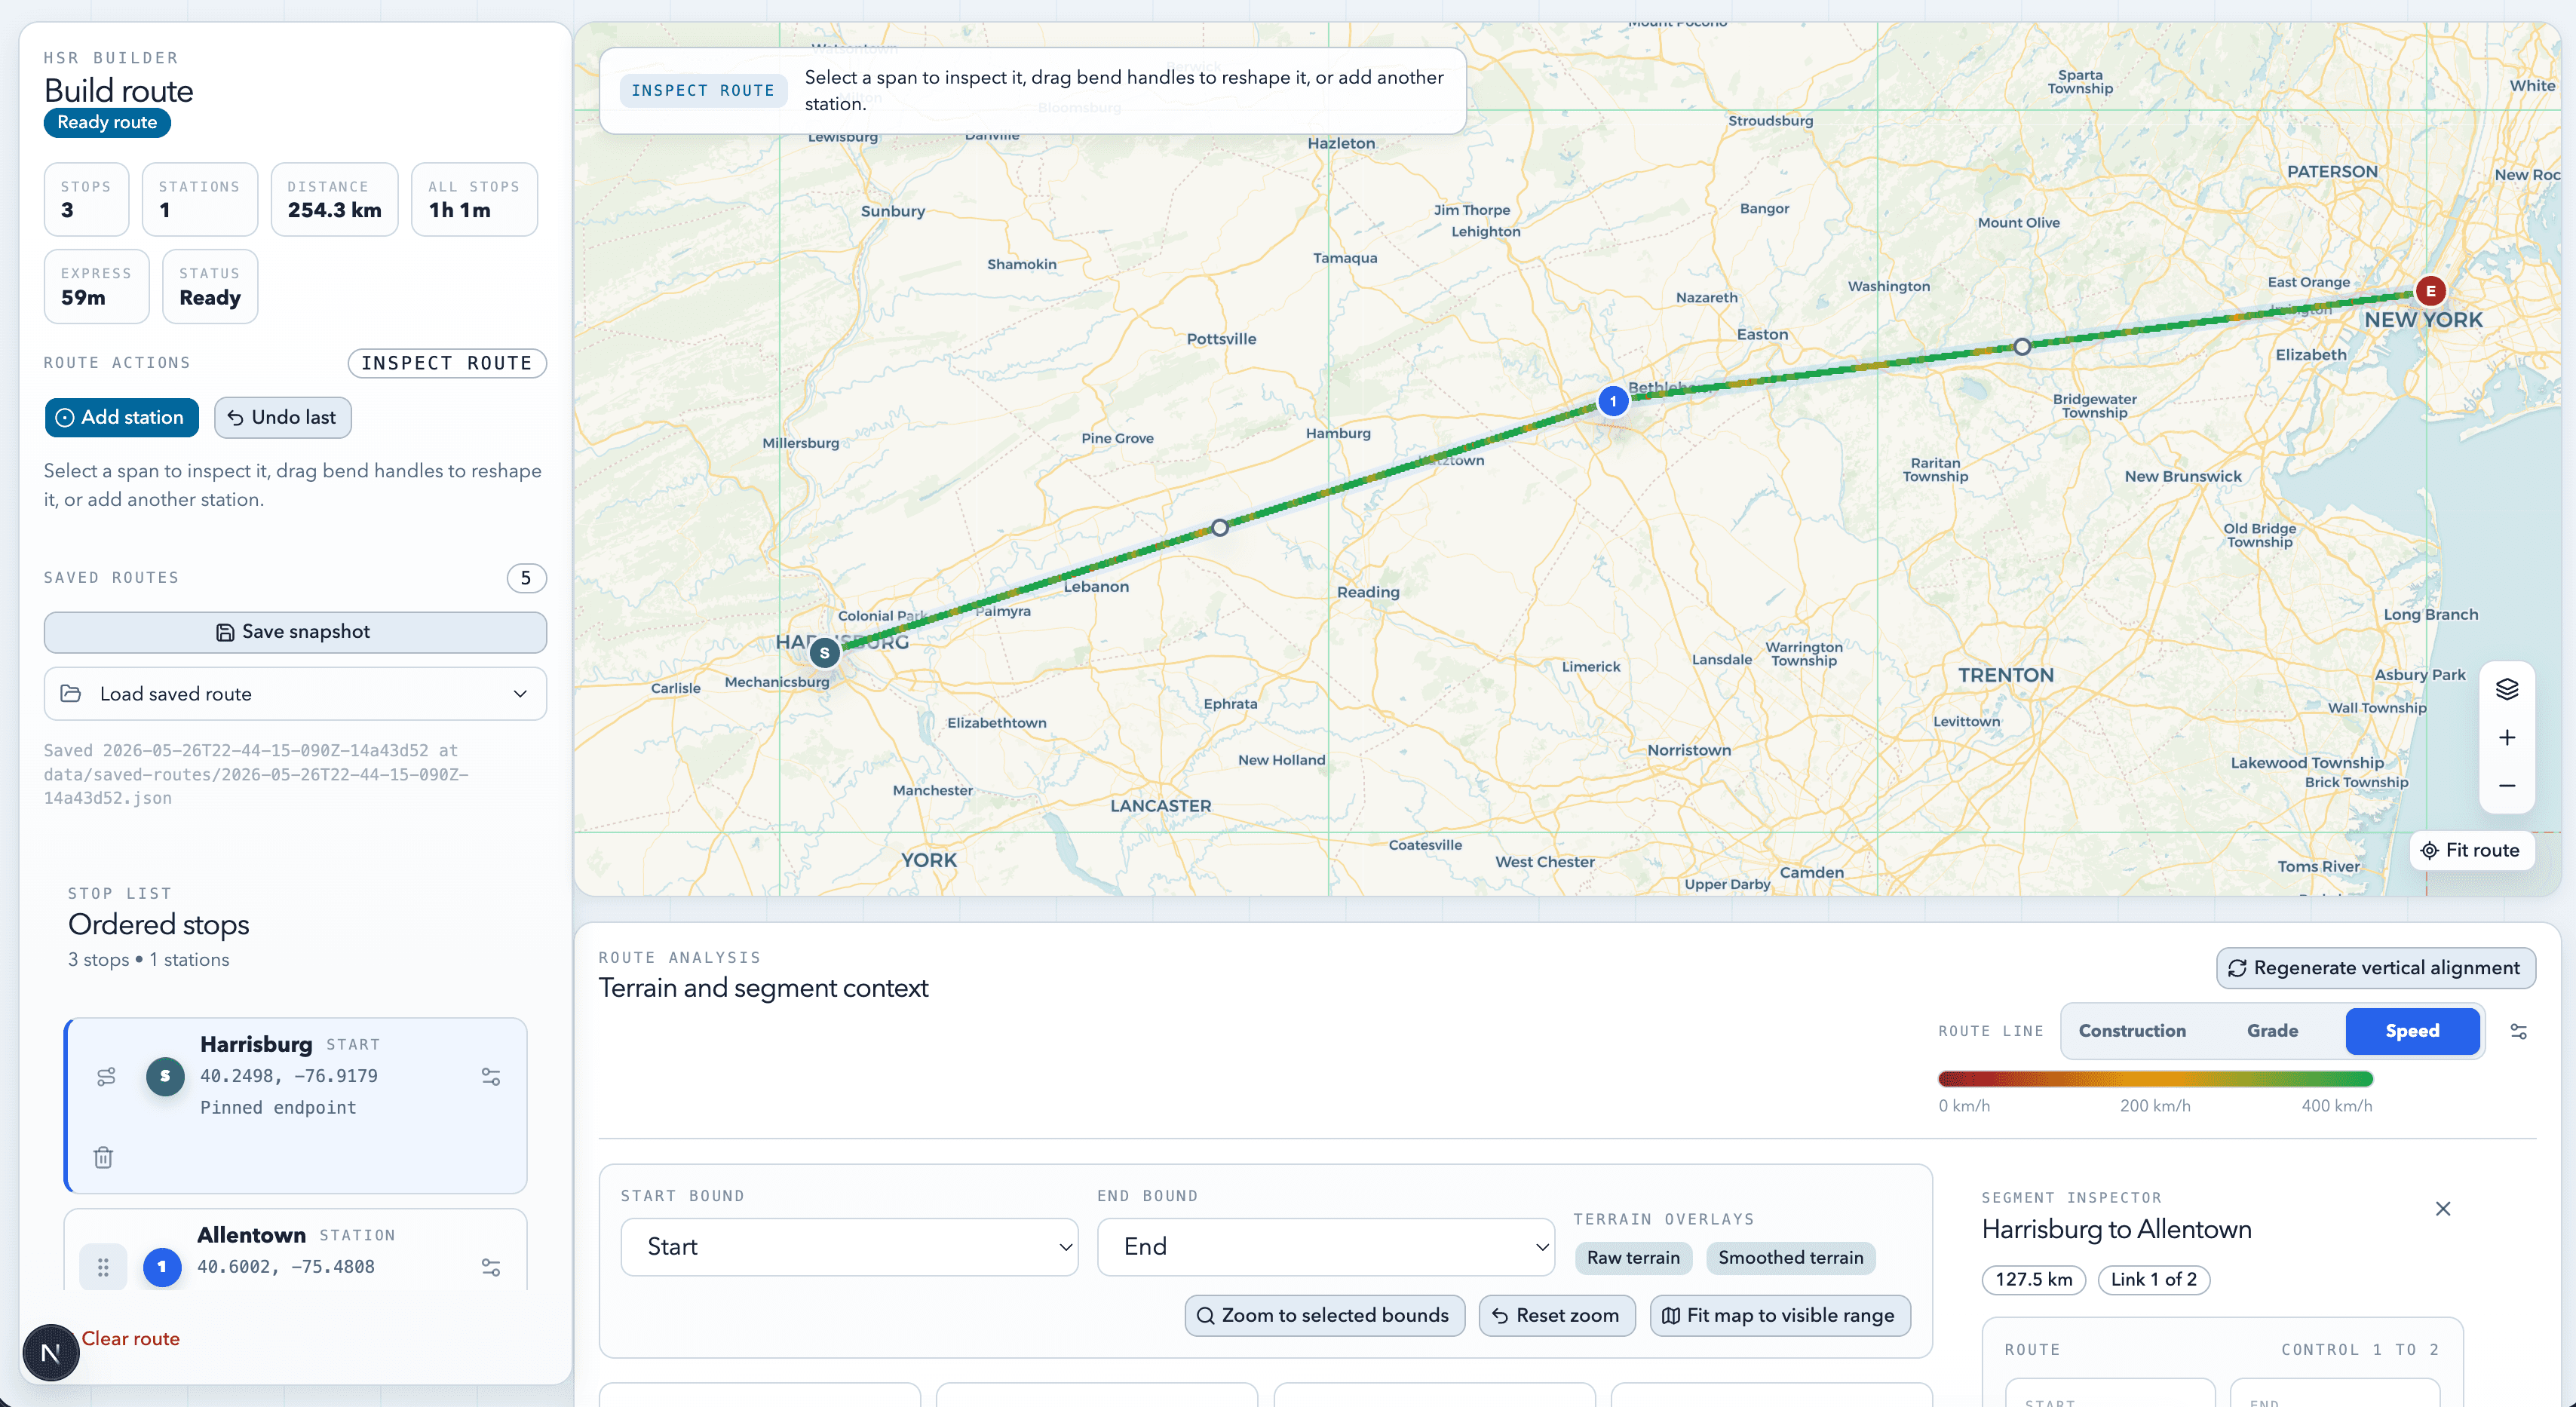
The main experience is a route editor built around an interactive Leaflet map. A user places a start point, end point, stations, and intermediate route nodes, then drags, reorders, removes, or edits them while the route stays live.
The editor turns the visible route into a designed alignment instead of a simple polyline. It uses design-speed settings and CAHSR-derived constraints to estimate horizontal curve limits, speed restrictions, transition spacing, and segment details.
Terrain analysis samples USGS elevation data along the alignment, builds an elevation profile, smooths noisy samples, and can generate a preliminary vertical alignment that tries to follow terrain while respecting grade and speed constraints.
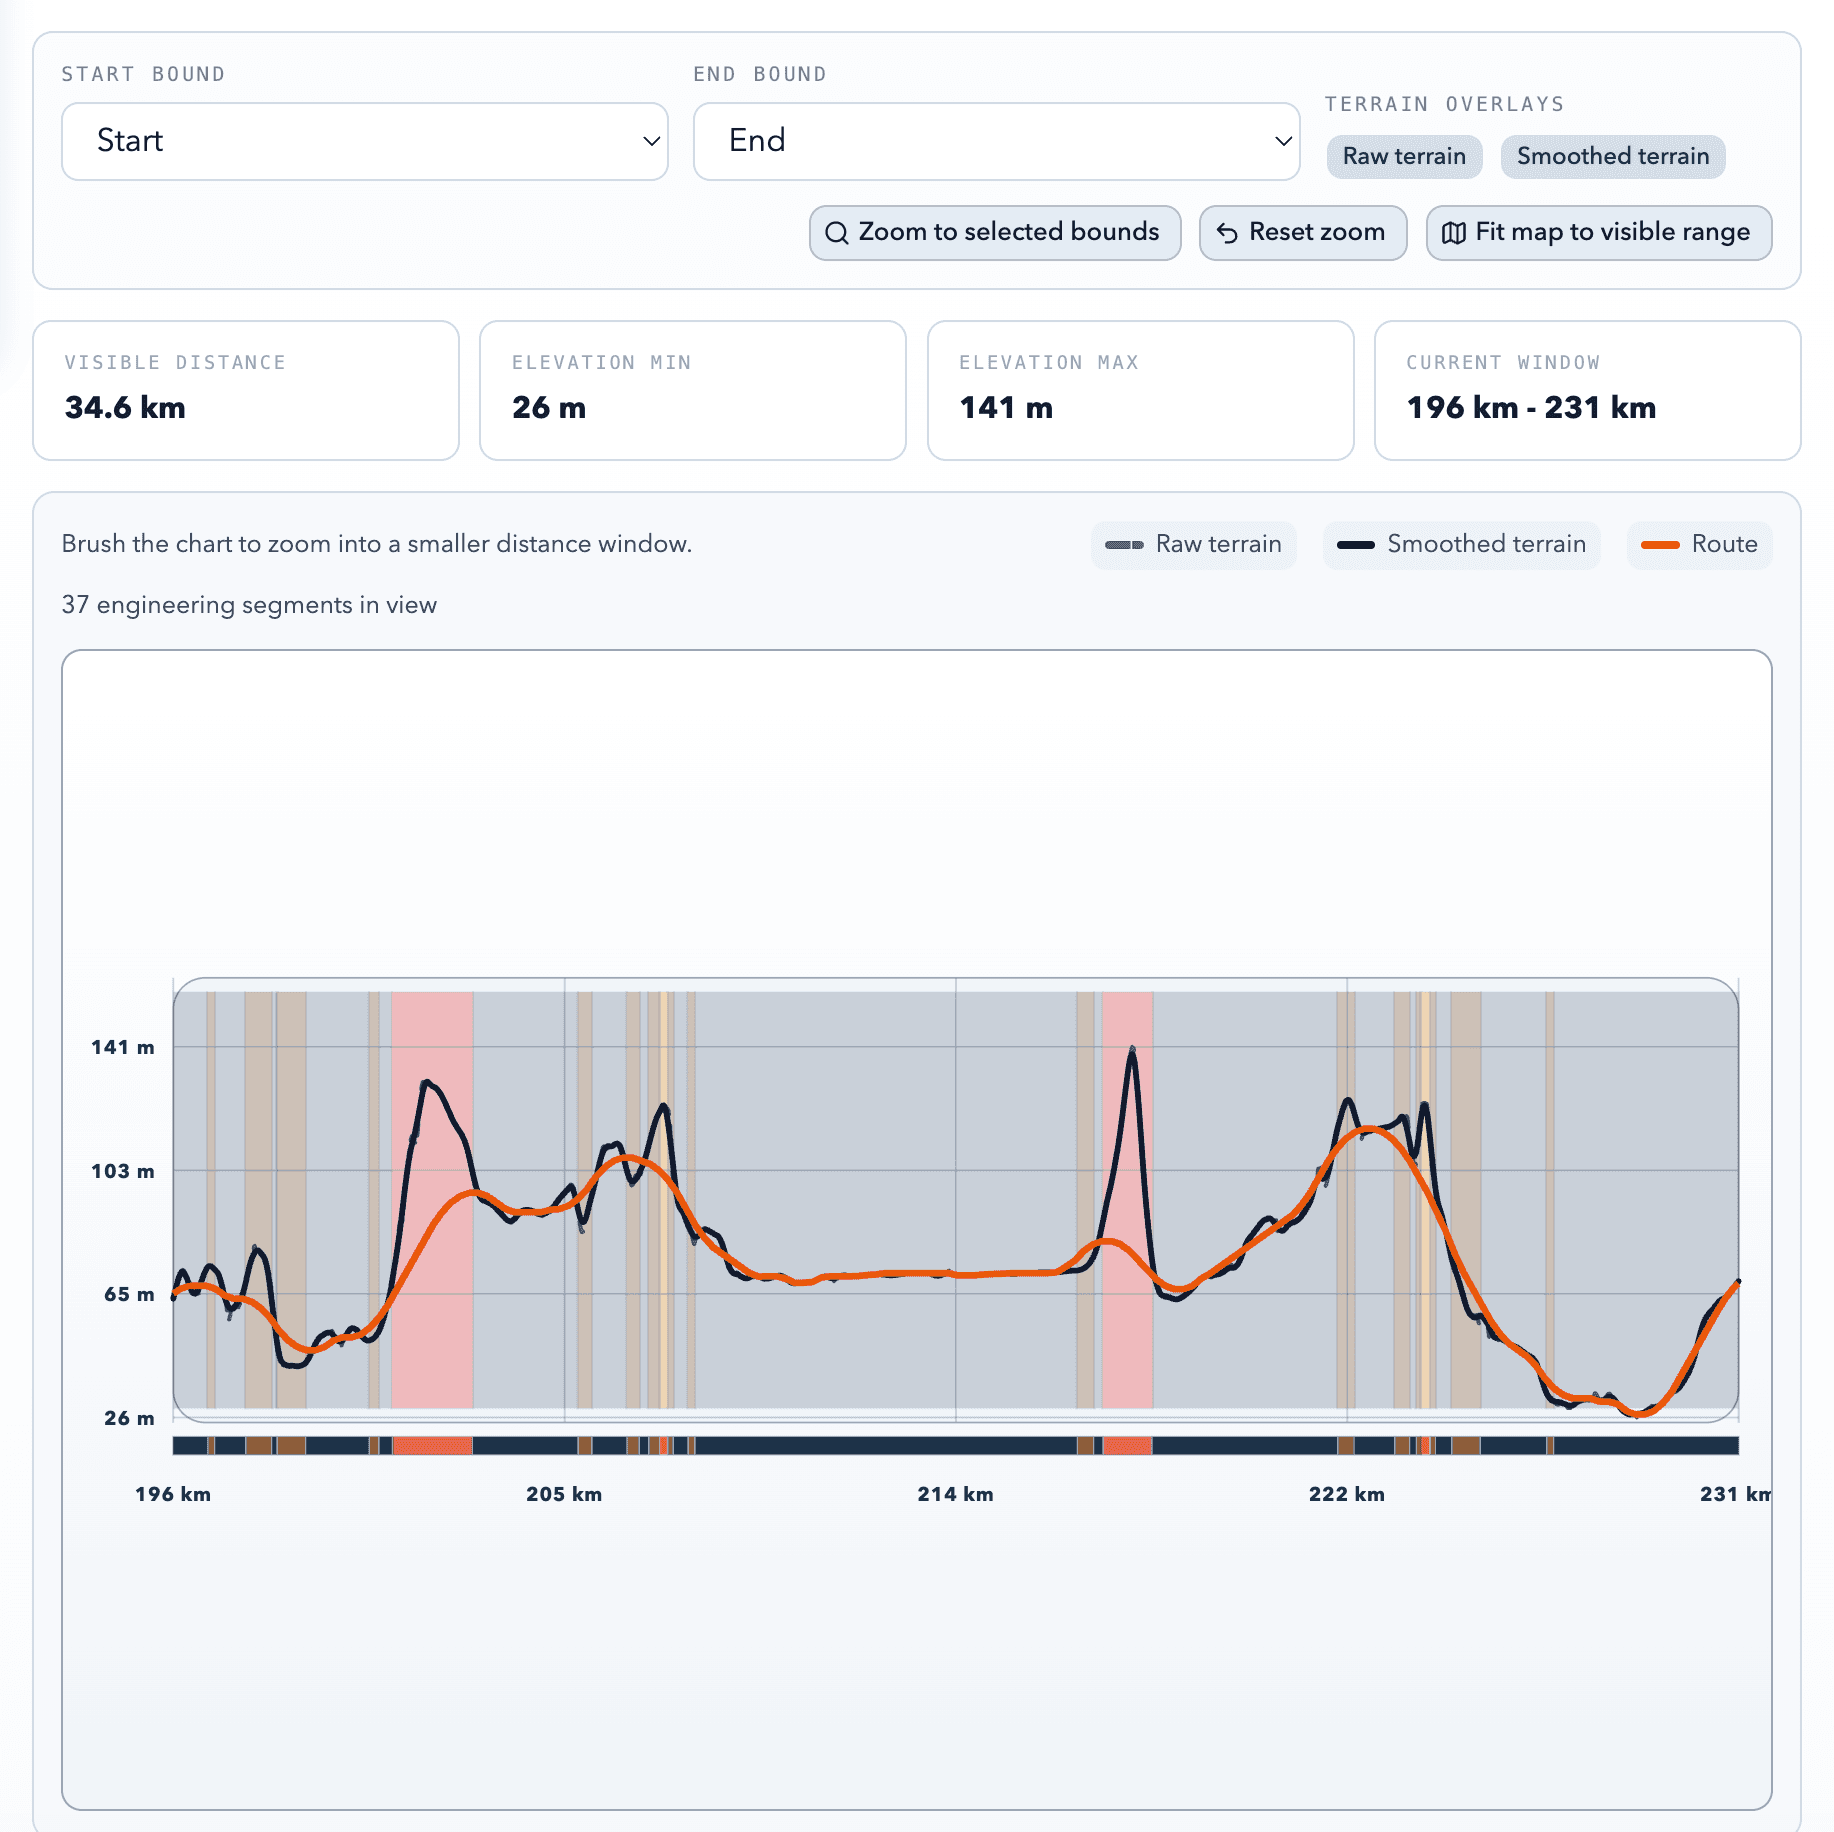
A zoomed terrain profile makes the route's vertical tradeoffs easier to inspect than the full-corridor view.
The analysis also classifies construction implications. A user can inspect likely surface, retained earth, cut, fill, tunnel, bridge, and viaduct sections, then review the construction mix by distance and percentage.
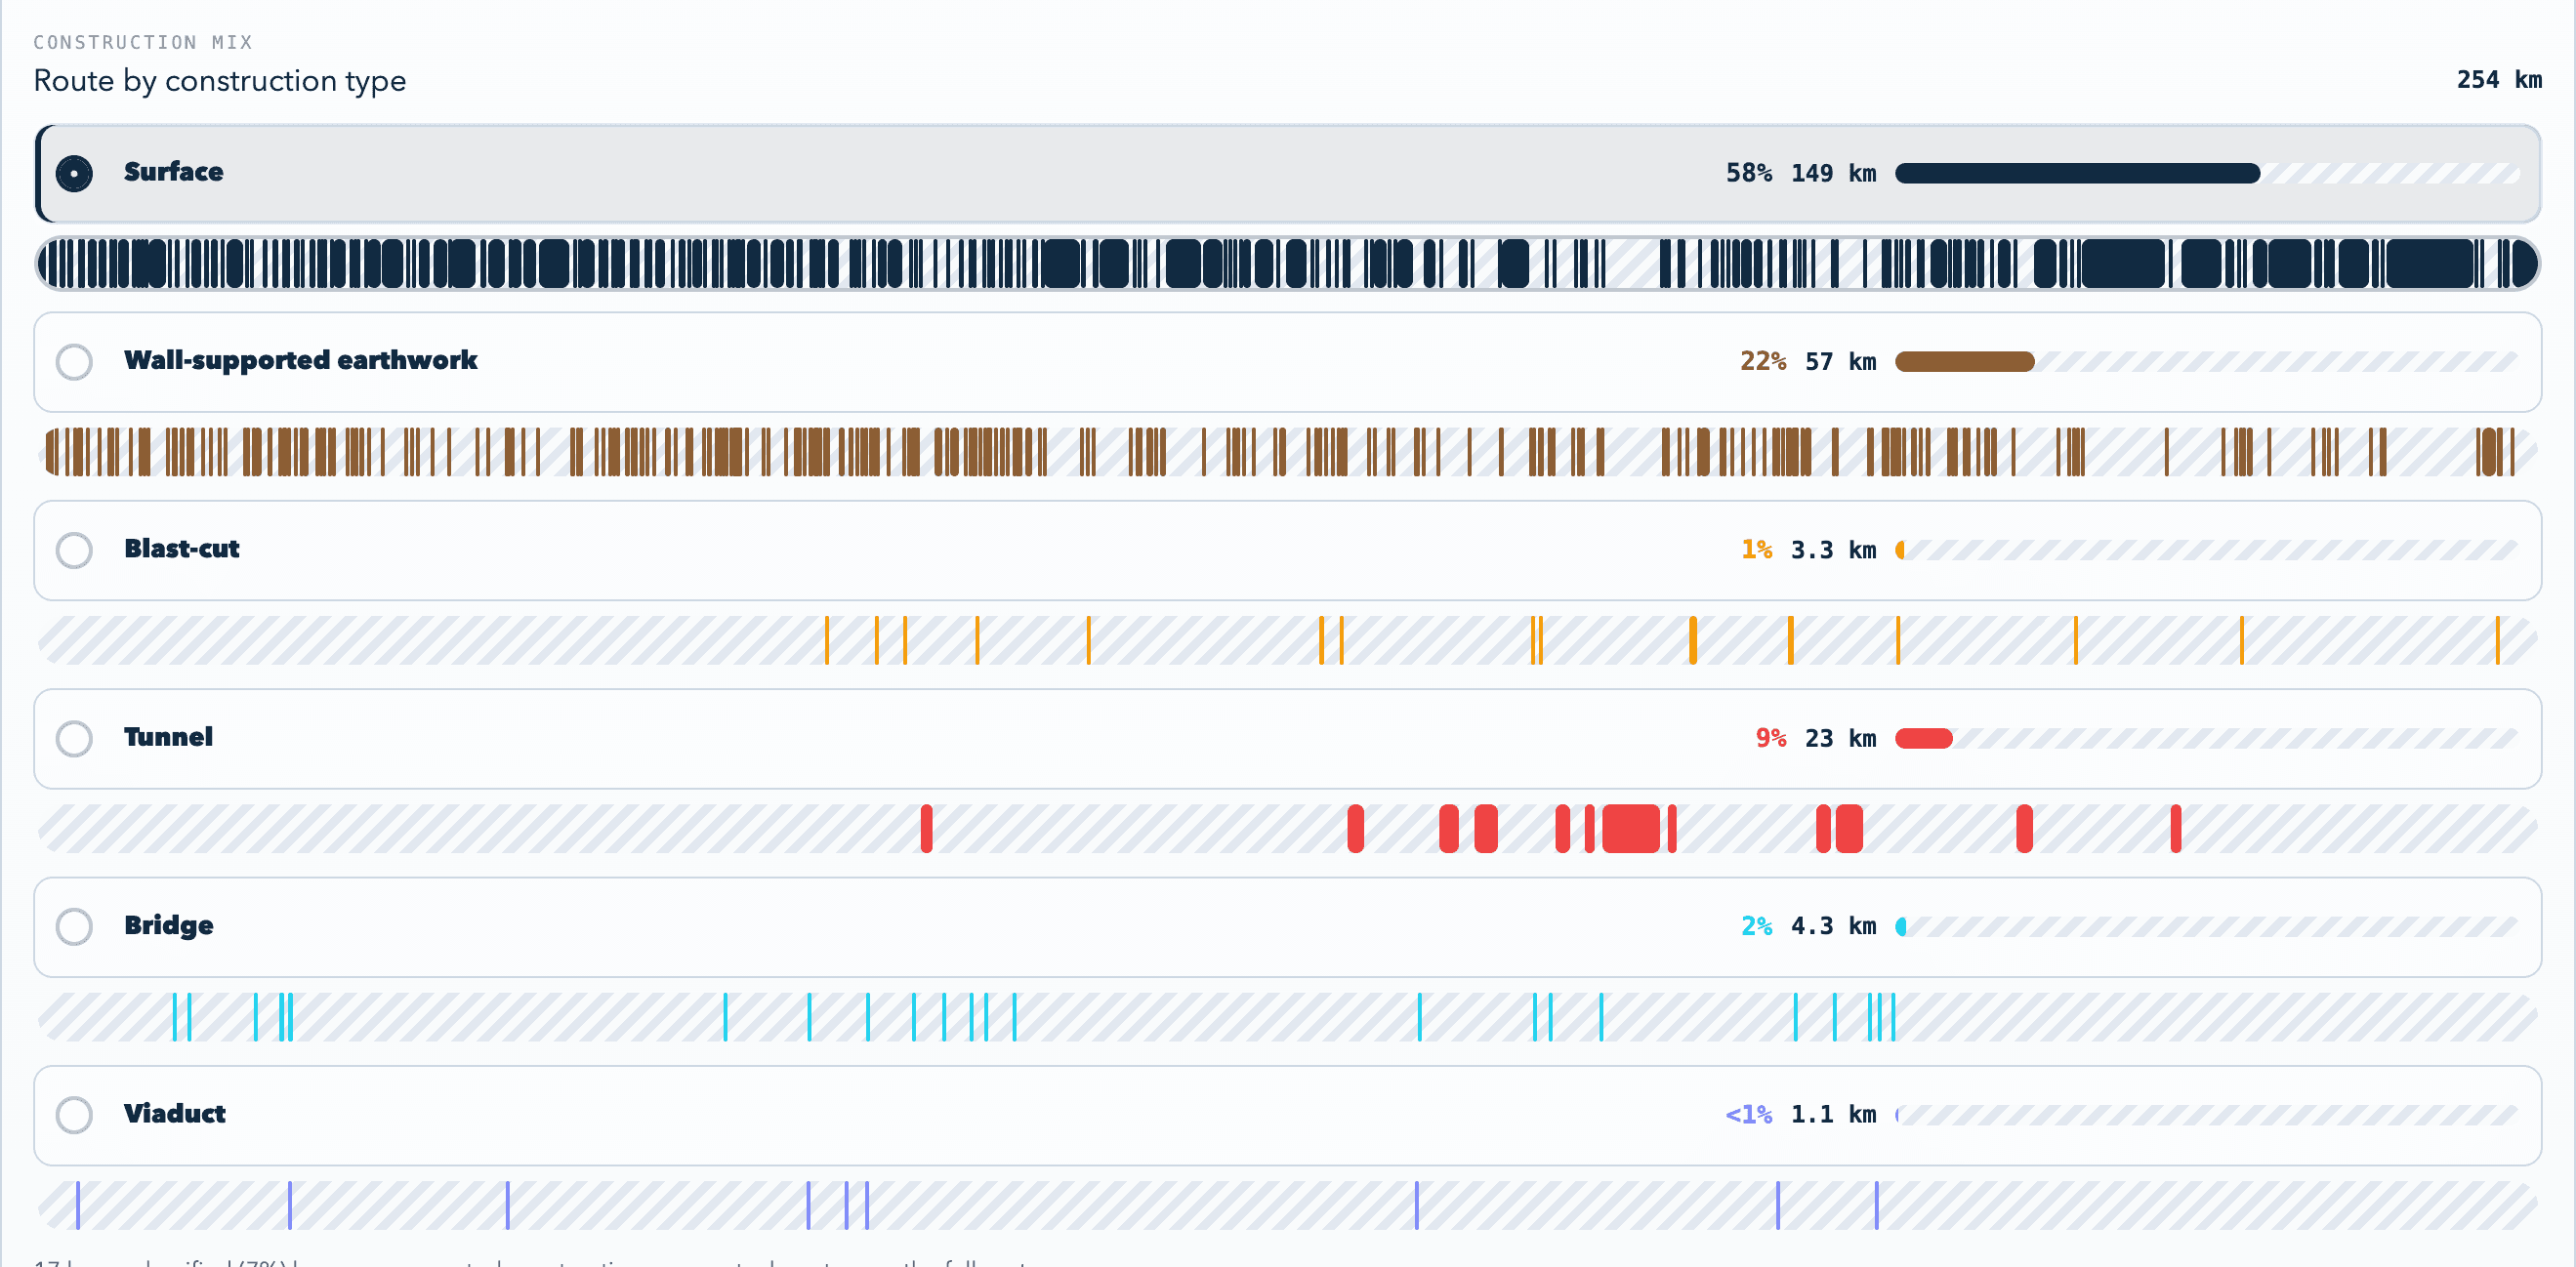
The construction mix view turns the optimized profile into route-length estimates by structure type.
Routes can be saved and loaded as snapshots, including geometry, analysis settings, and terrain diagnostics when available.
How It Works
The technical core is the path from user-drawn geometry to engineering feedback. The frontend is a Next.js and React application with Leaflet for map interaction.
The route drafting layer converts user inputs into ordered route geometry and estimates horizontal design constraints from the selected design speed. Terrain analysis then samples USGS elevation data along that route. The app can use local terrain tiles in development and Cloudflare R2-hosted tiles when deployed.
The sampling layer reports missing coverage, so the UI can distinguish between an infeasible route and an unavailable dataset.
The vertical optimizer evaluates candidate route elevations across the terrain profile, rejects states outside hard design limits, and scores alternatives using grade, speed, structure type, and configurable construction cost weights. That produces a route profile that is more useful than simply following the ground surface.
Construction classification turns optimized samples into route segments. The UI renders those segments on the map, shows profile bands, and summarizes the route by construction mix.
Product And Engineering Decisions
I kept the interface focused on route planning rather than building a generic GIS tool. The map is for drawing and inspection, the side panels are for route structure and settings, and the profile view explains why a route is or is not plausible.
I separated the domain logic from the UI. Route drafting, terrain sampling, alignment settings, smoothing, construction statistics, profile views, and snapshot handling live in testable library modules.
Cloudflare support shaped the data path. Terrain data is too large to bundle with the app, so deployed analysis can read from R2. Long-running vertical-alignment jobs also have to account for serverless runtime limits, so the app supports progress reporting and a terrain-profile mode for lighter analysis.
What I Would Improve Next
The next version would make comparison and validation stronger: richer cost modeling, side-by-side scenarios, exportable route reports, shareable links, broader terrain coverage, and calibration against real-world corridors.
I would also make the before-and-after effect of generated vertical alignment easier to see, especially when comparing competing routes.
© Adam Kramer.RSS